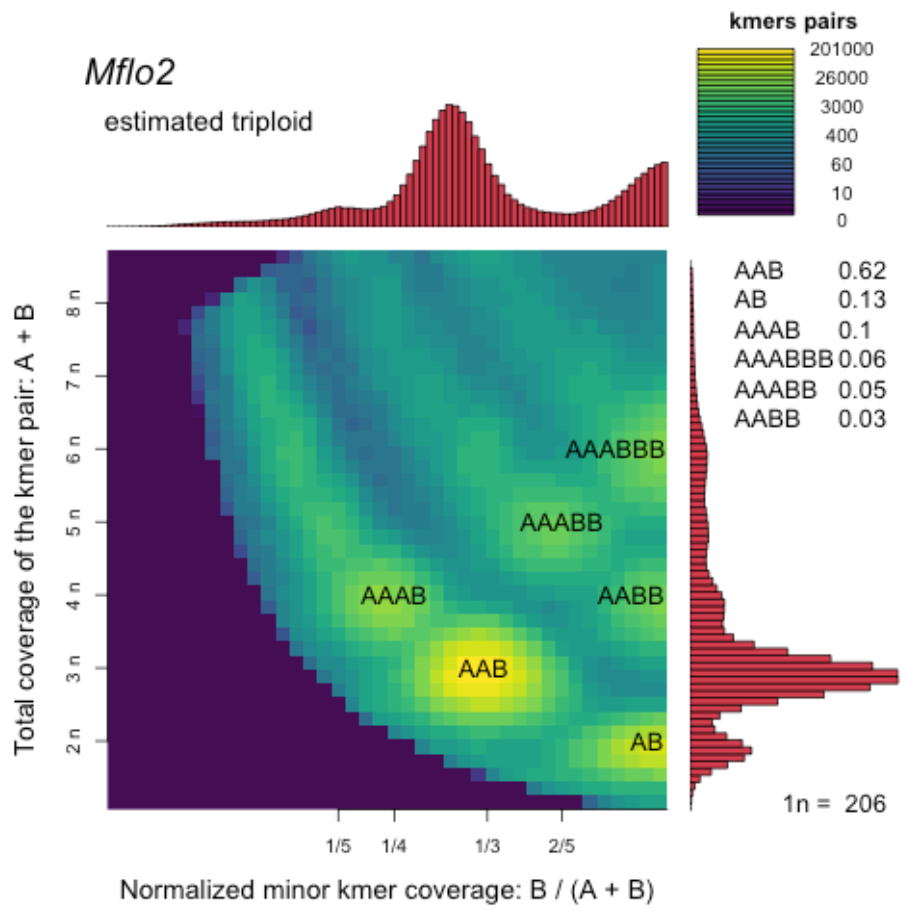
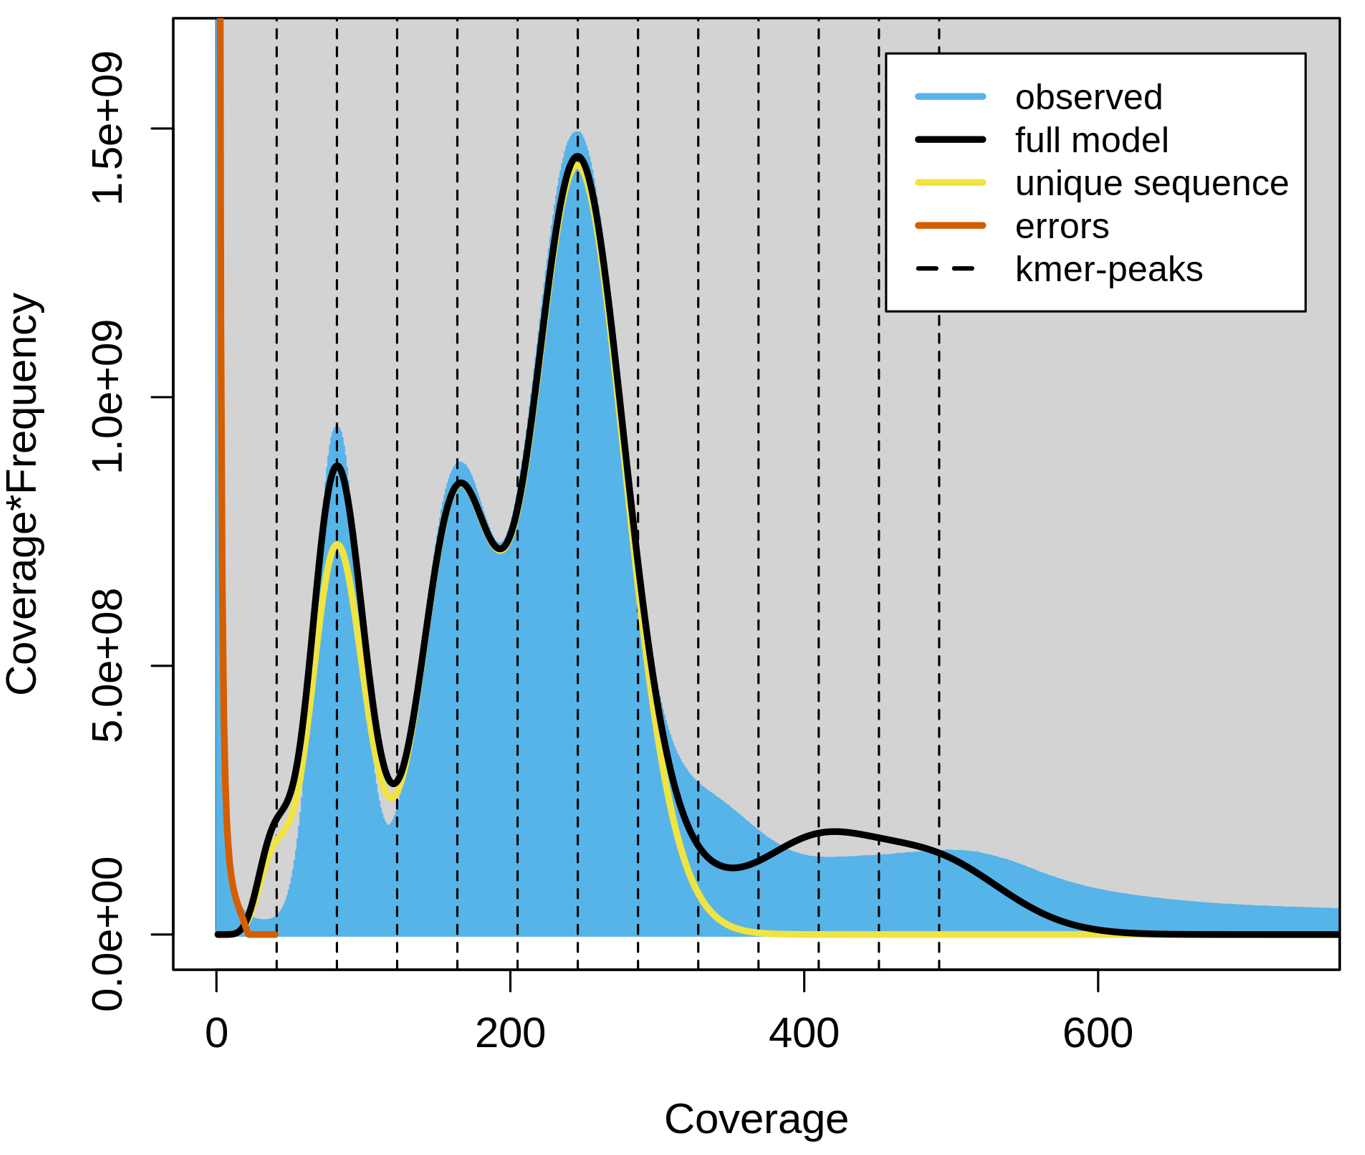
基因组组装之前,有一些问题还是需要注意的, 可以系统性地称为genome survey,这是一个非常简单的分析,但是其实有一些问题是值得注意的 Genome Survey一般基于Illumina short reads进行分析,因为二代测序便宜,先测出来试试水, 再判断三代的数据量,这应该算是一个非常经济实惠的做法。 1)fastp、Trimmomatic等软件挑一个过滤低质量序列 2)Jellyfish 2.3.0、KMC3 我个人其实比较喜欢KMC,因为可以直接读取 3)Genome Scope 2.0、GCE等软件,挑一个进行genome size、heterozygosity等指标的估计 我个人比较熟悉的还是Genome Scope 2.0,因为这个软件可以用于判断auto-tetraploid和allo-tetraploid, 同时作者Michael C. Schatz的实验室还开发了FALCON~ Shell script: “哼男人,嘴上说着喜欢KMC,但是却用Jellyfish”, Shell script: 注意点:为什么要用 就好比原本的运行方式为 注意点: Genome Scope 2.0的分析需要将k-mer spectrum的upper limit设置得高一些,不然后续genome size估计塌缩比例会特别大。 1)The estimation of genome size, heterozygosity, etc. Shell script: 2)Kmer-pair plot 这部分官网其实给出了比较好的流程,我就只是简单概括走一下, 结果示意图如下, 基因组大小估计需要注意的点, 0)三代数据不适合用于Kmer分析,因为测序错误率高了很多,会对分析结果产生非常大的影响, 但是HiFi reads以及canu和falcon产生的corrected reads可以很好的适用于Genome Scope分析 1) 2) 比如在genomescope2.0 model下,如果在输入数据和模型都已经定下来的基础上,将 3)结果中的 前者的 后者的 transformed linear: linear plot: 4)Genome Scope 2.0分析时,如果将过多的kmer判定为了 首先需要明确的一个点是:Genome Scope 是基于diploid进行编写的。 关于二倍体物种的基因组大小估计,如何理解。我想要举一个非常简单的例子来理解: 给个用kmer将genome给“划分”开的示意, 假设当前的基因组非常纯合(-> homozygous, not -> heterozygous),kmer会在某一个频数上呈现一个峰值, 但是如果当前的基因组杂合度上升了,也就是我们一般在文献中看到的heterozygosity,kmer在另一个频数较小的区域,也会呈现一个峰值,也就是Genome Survey中提到的杂合峰 就比如下图中的T,是A对应的allele。该种情况的存在,会导致kmer出现另一种情况,从而降低了纯合峰的高度,比如下图的例子就表示了对应位置kmer的频数,从4降低到了2, 即可以将diploid的kmer topology理解为:aa,ab 所以,为了满足polyploid的产生,Genome Scope 2.0被开发 —— 基于负二项分布的Kmer模型,用于估计genome size、heterozygosity等。 三倍体的kmer topolygy:aaa(3种haplotype均一致),aab(有1种haplotype和另外2个haplotype存在区别),abc(3种haplotype各不相同) 四倍体的kmer topology:aaaa,aaab,aabb,abcd [1] https://github.com/schatzlab/genomescope/issues/32 [2] https://github.com/schatzlab/genomescope/issues/43 [3] https://github.com/schatzlab/genomescope/issues/48 [4] https://github.com/schatzlab/genomescope [5] https://github.com/KamilSJaron/smudgeplot
分析流程
.gz文件(绝对不是因为之前KMC作者帮助我愉快地解决了一个Bug),但是解决jellyfish脚本的过程中也让我对Shell Kernel有了一个更深刻的理解。fastp
vim fastp.sh
sh fastp.sh 2>fastp.err.log &
#!/bin/bash
# Preset
dir=<specicy_path_of_your_rawdata>
echo "The raw dataset is placed at $dir"
echo "Now running Quality control"
thread=24    # set 24 threads
quality=20   # set quality cutoff to 20 based on Phred33
#
fastp -w $thread -q $quality -i $dir/sample1.fq.gz -I $dir/sample2.fq.gz -o ./sample_clean_1.fq.gz -O ./sample_clean_2.fq.gz
Jellyfish: count k-mer
vim jellyfish.sh
chmod 777 jellyfish.sh  # key step, otherwise the script below will report syntax error
./jellyfish.sh 2>jellyfish.err.log &
# Preset
dir=<specicy_path_of_your_cleandata>
echo "The clean dataset is placed at $dir"
echo "Now running Jellyfish Kmercount"

# 17mer
echo "Now running 17mer counting"
content1="jellyfish count -C -m 17 -o ./sample.17mer.jf -s 10G -t 24 <(pigz -dc $dir/sample_clean_1.fq.gz) <(pigz -dc $dir/sample_clean_2.fq.gz)"
echo "The command is $content1"

jellyfish count \
-C \
-m 17 \
<( pigz -dc $dir/sample_clean_1.fq.gz ) <( pigz -dc $dir/sample_clean_2.fq.gz ) \
-o ./sample.17mer.jf -s 10G -t 24


# 21mer: recommanded by author
echo "Now running 21mer counting"
content2="jellyfish count -C -m 21 -o ./sample.21mer.jf -s 10G -t 24 <(pigz -dc $dir/sample_clean_1.fq.gz) <(pigz -dc $dir/sample_clean_2.fq.gz)"
echo "The command is $content2"

jellyfish count \
-C \
-m 21 \
<( pigz -dc $dir/sample_clean_1.fq.gz ) <( pigz -dc $dir/sample_clean_2.fq.gz ) \
-o ./sample.21mer.jf -s 10G -t 24
chmod 777?
答:未经777赋予可执行权限的脚本,仍为shell脚本,需要指定bash或者sh来运行程序,即不可从jellyfish直接开始运行程序,bash <script_name>.sh,现在要修改成为./<script_name>.sh的运行方式,不然就会出现syntax errrorJellyfish: k-mer spectrum generation
jellyfish histo -t 24 -l 1 -h 500000 sample.17mer.jf > sample.17mer.histo &
jellyfish histo -t 24 -l 1 -h 500000 sample.21mer.jf > sample.21mer.histo &
upper limitation的修改。Genome Scope 2.0 + Smudeplot
vim genomescope.sh
chmod 777 genomescope.sh
./genomescope.sh 2>genomescope.err.log &
script=<path_to_your_genomescope_repo>/genomescope.R
dir=<where_kmerspectrum_deposited>
Rscript $script -i <input_histo> -o ./ -n <outputname> -p <ploidy_level> -k <kmer_used>
dir=<specify_your_kmercount_database>
L=$(smudgeplot.py cutoff <histo_from_kmc> L)
U=$(smudgeplot.py cutoff <histo_from_kmc> U)
echo $L $U # these need to be sane values
# conda activate genomesurvey
kmc_tools transform $dir/<kmc_db> -ci"$L" -cx"$U" dump -s smudgeplot_kmc_db/<kmc_db>.kmc_L"$L"_U"$U".dump
# conda activate smudgeplot
smudgeplot.py hetkmers -o smudgeplot_kmercounts/<kmc_db>.kmc_L"$L"_U"$U" < smudgeplot_kmc_db/<kmc_db>.kmc_L"$L"_U"$U".dump

# Plot
smudgeplot.py plot <kmc_db>._L"$L"_U"$U"_coverages.tsv

jellyfish histo输出时指定的maximum kmer-freq,会极大地影响到genome size的估计,因此需要根据自己的数据进行调整,一般100000再往上也可genonomescope.R的-p以及--kcov的设置,都会影响到genome size的估计--kcov设置为原本的一倍,则genome size的大小估计会减半(此处感兴趣的,我建议还是自行搜索下基于kmer计算genome size的公式)transformed_linear_plot和linear_plot有什么区别?observed曲线经过了一个转换,越往后的peak其峰值越大,即在原始的kmer freq上乘了一个n(n代表第n个peak),observed曲线为实际观测到的一个数值,没有经过上述转换

error,最终的genome size就会小了特别多(基于genome size的计算公式)背后的原理
				kmer:   ---A--
                		 --A---
                		  -A----
                		   A-----
				genome: ---A-----------------------------------------------
				kmer:   ---A--
                		 --A---
				genome: ---A-----------------------------------------------
				           T
				        ---T--
				         --T---
参考资料
Hi,这里是有朴的第二大脑。
很高兴与你相遇
很高兴与你相遇